Analyzing PostgreSQL Performance Using Flame Graphs
DRANK
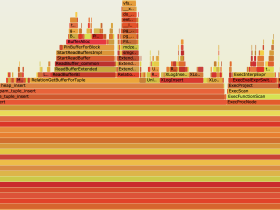
A flame graph is a graphical representation that helps to quickly understand where a program spends most of its processing time. These graphs are based on sampled information collected by a profiler while the observed software is running. At regular intervals, the profiler captures and stores the current call stack. A flame graph is then generated from this data to provide a visual representation of the functions in which the software spends most of its processing time. This is useful for understanding the characteristics of a program and for improving its performance. This blog post explores the fundamentals of flame graphs and offers a few practical tips on utilizing them to identify and debug performance bottlenecks in PostgreSQL.